
Completed foreclosures across the country rose 42% from a year ago, per ATTOM. Redfin reports 58% more sellers than buyers, its widest gap since it started tracking in 2013. Put those two numbers side by side and it sounds like a crash is starting.
So is San Diego next? To find out, I skipped the national reports and went to the San Diego County Recorder. Every foreclosure in the county leaves a paper trail there. Here's what our own records show.
What the Headlines Leave Out
ATTOM collects foreclosure filings from across the country. In August, it counted 5,794 completed foreclosures, up 42%. New foreclosure starts rose 7% to 25,894.
Those numbers are true. But read past the headline. ATTOM's own report puts foreclosure activity below where it sat before the pandemic, and its CEO called volumes well below historical norms. The count is climbing from a low floor. That part rarely makes the headline.
How a California Foreclosure Works
A California foreclosure moves through three steps, and the county records each one.
- Notice of default. For mortgages covered by federal servicing rules, the lender generally cannot begin foreclosure until the borrower is more than 120 days behind on payments. Think of it as a warning, not a sale.
- Notice of trustee sale. This sets the auction date.
- Trustee's deed. Once the auction ends, this document hands the home to the new owner. This is the step that counts as a completed foreclosure.
San Diego’s Numbers
I pulled the count for each step for January through September of this year and compared it to the same nine months of 2025.
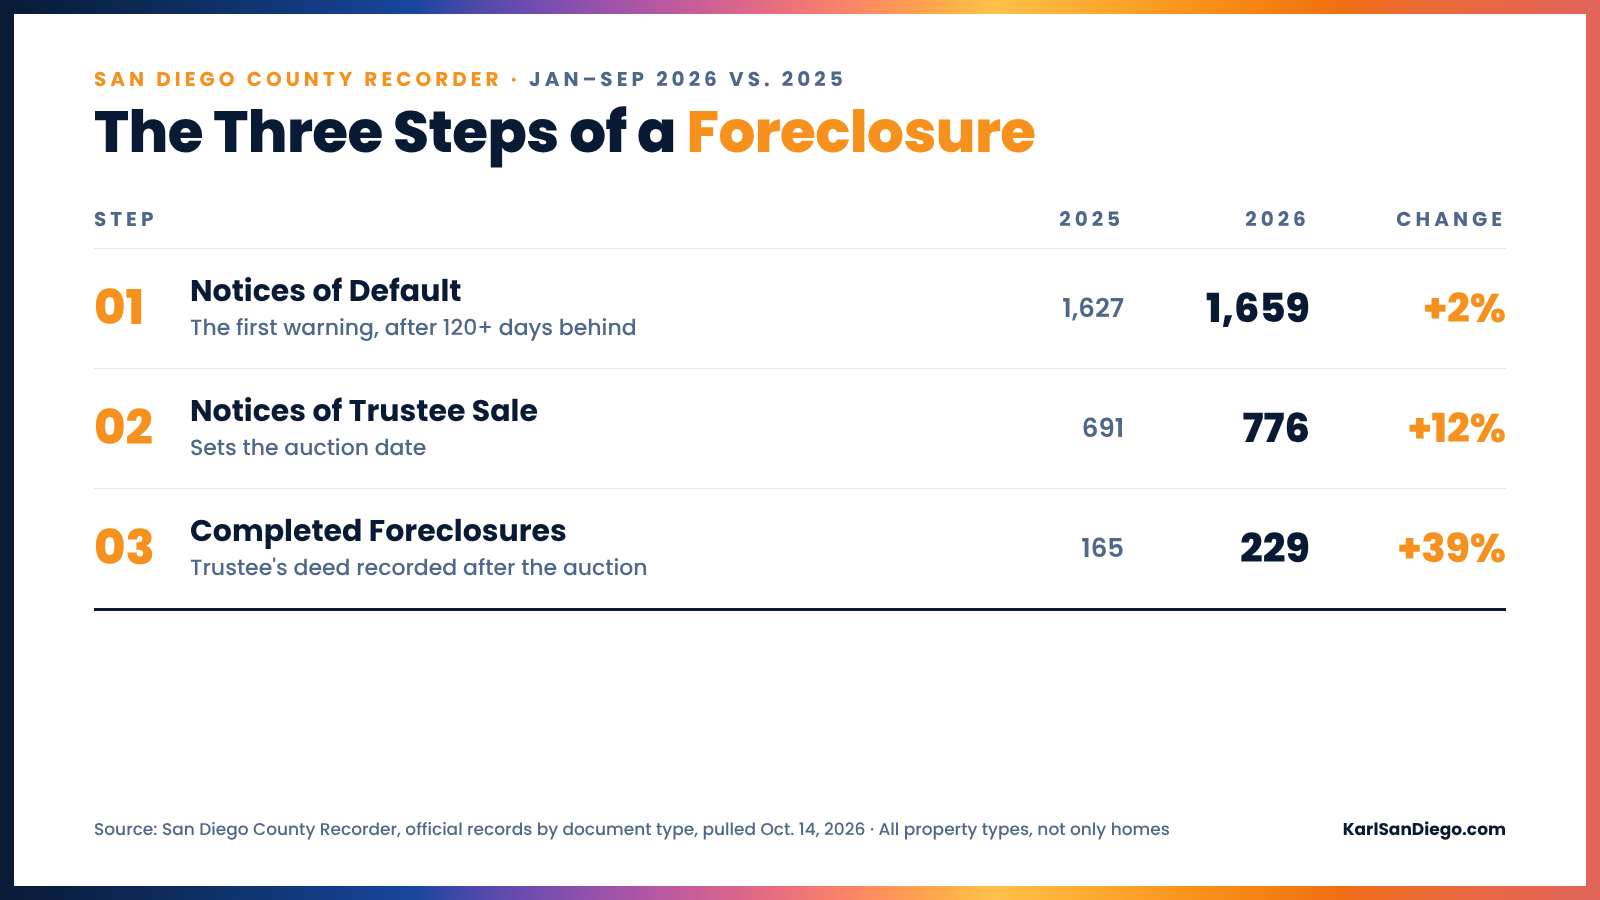
San Diego is heading the same way as the national number. The early warnings barely moved. Auction notices rose 12%. Completed foreclosures jumped 39%.
A caution on these counts. The county records cover all property, homes and everything else. Use them to read the trend and its scale. They are not a precise tally of houses.
A 39% Jump in Actual Counts
Percentages are easy to misread. Going from 165 to 229 over nine months works out to about seven more completed foreclosures a month.
In September, the county recorded 39 trustee’s deeds. For a sense of scale, that’s about 2.2% of the 1,737 homes that closed escrow countywide that month. These are different datasets: the county count covers all property types, so this comparison is not a residential foreclosure rate.
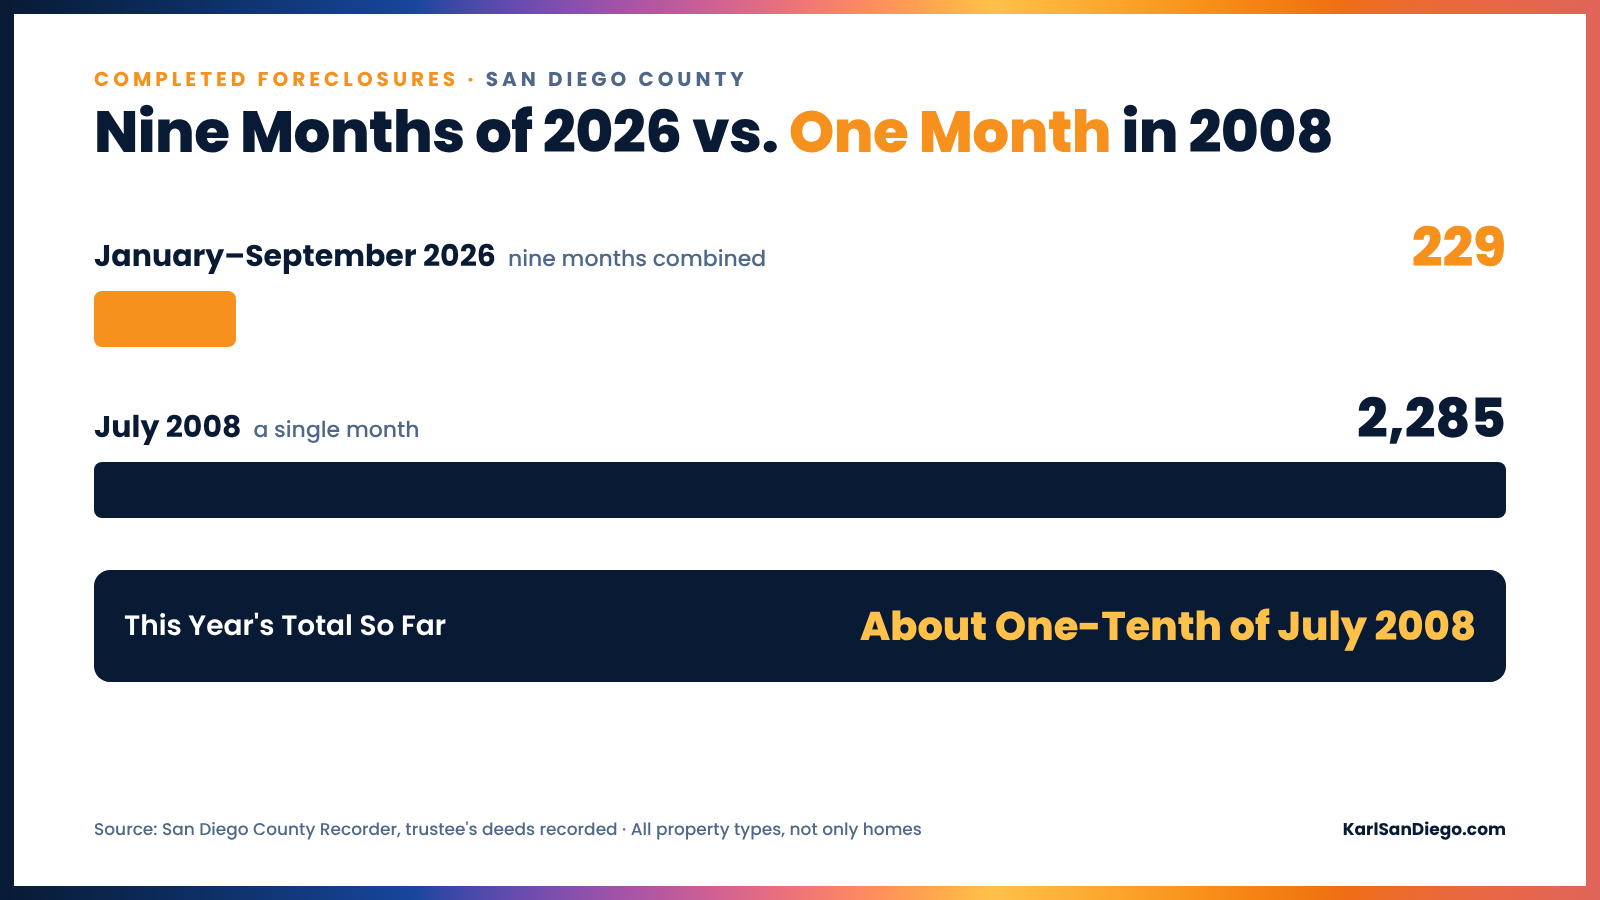
Now compare it to the last crash. In July 2008, the county recorded 2,285 completed foreclosures. In one month. All nine months of 2026 add up to roughly a tenth of that single month.
Why San Diego Isn't Following the Sun Belt
Falling prices can make foreclosures more likely. When a home is worth less than the loan, an owner who loses a job or goes through a divorce has no clean way out. Selling won't cover what they owe.
Here, house prices kept climbing. San Diego's median detached sale price hit $1,079,000 in September, a 5.8% gain over last year. The median is the middle sale, with half above it and half below. There are almost 13% fewer detached homes for sale than a year ago. At the current pace, that supply would sell out in under two and a half months. Under four months of supply means sellers hold the advantage.
Rising prices build equity, the share of the home the owner owns outright. A San Diego owner who falls behind has a way out before the bank steps in. They sell, the sale pays off the mortgage, and the leftover money goes in their pocket. For most San Diego owners who receive a notice of default, that exit is still open.
The Part of the Market I'm Watching
Condos and townhomes. Their median sale price was $670,000 in September, flat compared with a year earlier. There are roughly 6% more of them for sale than last year, and about four months of supply. That puts them halfway between a seller's market and a balanced one.
When prices stall, equity stays thin. A condo bought two or three years ago hasn't built the cushion a detached home has. If that owner hits a rough patch, a sale won't get them out clean. The county's numbers lump condos and houses together, so I won't predict a wave. I'll keep tracking the county records against condo prices. If foreclosures climb while condo prices slip, that's the signal.
The Bottom Line
The national reports are accurate. They describe markets that boomed, overbuilt and are now watching prices fall. San Diego's count is rising, but from a small base, and most owners here still have equity to fall back on. A wave of local foreclosures isn't showing up in the data yet.
Watch the Full Video
This post covers what San Diego County's records show. The full video goes further. I walk through where foreclosures are rising across the country and why, which Sun Belt markets tipped into buyer's markets, where San Diego lands on Redfin's list, how the latest Fed hike and 7% rates hit pending sales, and what buyers, sellers and condo owners should do right now.
Watch the full video on YouTube
If you have any questions or concerns, don't hesitate to reach out.
As always, I'm Karl Kyler, your San Diego Realtor.
Karl Kyler · Karl San Diego
eXp Realty of Southern California, Inc.
KarlSanDiego.com · 619-829-2908
DRE #01439839
Sources
- ATTOM — August 2026 U.S. Foreclosure Market Report
- Redfin — August 2026 buyers versus sellers
- CFPB — foreclosure timelines
- September 2026 San Diego MLS report
- San Diego County Recorder official-record document counts, January–September 2025 and 2026, September 2026, and July 2008; supplied county-record pull dated October 14, 2026.